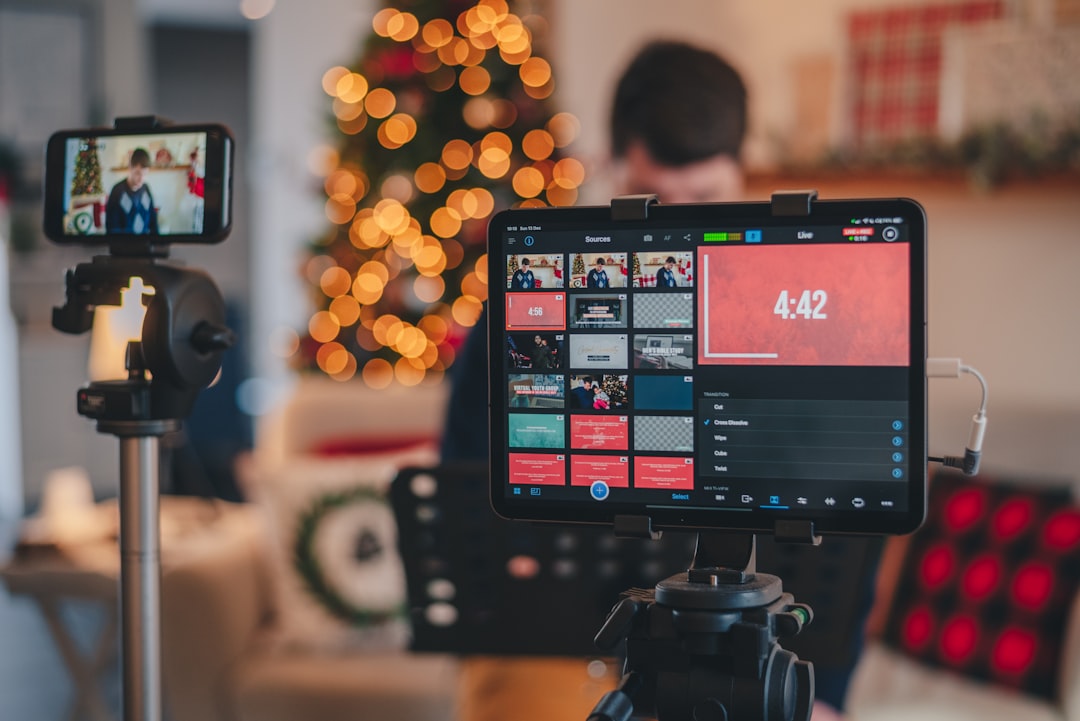
Live stream analytics turn a broadcast into a repeatable learning process. This guide explains which livestream metrics to track, how to connect changes to specific decisions, and how to run a practical post-stream review without treating every number as a verdict on your content.
Overview
A useful analytics review answers three questions: did the right people find the stream, did they stay, and did they take the next action you wanted? The answer is rarely contained in one metric. Concurrent viewers may show how many people were watching at a moment in time, but retention and average watch time provide more context about whether the broadcast held attention. Chat rate can indicate participation, while follows, subscribers, clicks, or revenue show whether the stream supported a broader goal.
Start by choosing one primary objective for each broadcast. For example, a product demonstration may prioritize qualified clicks or sign-ups, while a community Q&A may prioritize returning viewers and chat participation. You can still record the full set of available data, but a primary objective prevents you from changing the format based on a distracting secondary number.
Platform dashboards do not always define metrics in the same way. A platform may calculate average watch time from views, sessions, or another reporting unit; revenue may include or exclude certain transaction types; and attribution windows can differ. Record the platform, date range, stream length, and metric definitions alongside your numbers. Compare like with like whenever possible.
What to track
The following metrics form a practical baseline for a Twitch analytics guide, YouTube Live analytics review, or multistreaming report. Use the platform’s own definitions and label estimates clearly when combining data from more than one service.
| Metric | What it tells you | How to use it | Important limitation |
|---|---|---|---|
| Concurrent viewers | How many viewers were watching at the same time during points in the broadcast. | Identify peaks, dips, and moments that attracted or lost attention. | It is a moment-based measure, not a count of unique people who watched the entire stream. |
| Average watch time | How long viewers watched on average, according to the platform’s calculation. | Compare the performance of stream length, opening segments, and recurring formats. | Definitions and included views can vary by platform. |
| Retention | How the audience level changes throughout the broadcast or across key segments. | Locate early exits, strong segments, and points where pacing or clarity needs work. | Some dashboards provide limited detail or use different retention views. |
| Chat rate | The volume of chat activity relative to viewers or time, where reported. | Test prompts, questions, polls, guest segments, and moderation workflows. | Chat volume is not the same as sentiment, quality, or meaningful participation. |
| Click-through rate | The proportion of viewers or impressions that clicked a tracked destination, when available. | Evaluate calls to action, descriptions, pinned comments, overlays, or panels. | Attribution can be incomplete, especially across platforms or external links. |
| Follows or subscribers | The number of viewers who took a platform growth action during or around the stream. | Assess whether the topic and presentation gave viewers a reason to return. | Definitions, timing, and reporting windows differ between platforms. |
| Returning viewers | Whether people who watched previously came back for another broadcast. | Judge consistency, series formats, scheduling, and community-building efforts. | Platform identity systems and reporting may not capture every returning person. |
| Revenue | Reported earnings connected to the stream, such as tips, subscriptions, ads, or sales. | Compare revenue with the stream’s objective, audience quality, and production effort. | Gross and net figures, processing, refunds, timing, and attribution may differ. |
Also record contextual variables that numbers cannot explain on their own: stream topic, title, thumbnail or cover image, start time, duration, platform, guest participation, promotion used, technical problems, and the main call to action. A retention dip during an audio failure means something different from a dip during a routine transition. For production-related problems, review your live stream audio troubleshooting guide and check whether sound quality affected viewer behavior.
Cadence and checkpoints
Review performance at three levels so that one unusual broadcast does not determine your entire strategy.
After every broadcast
Within a day or two, capture the basic numbers while the stream details are easy to remember. Note the strongest and weakest moments, technical interruptions, notable chat questions, and any promotion that may have affected the result. Avoid making a major format change immediately unless the stream had a clear failure, such as unusable audio or a broken link.
Monthly
Compare a group of broadcasts with a consistent format. Look for direction rather than a single winner: is average watch time improving, are early exits becoming less frequent, or are returning viewers growing? Group streams by type when necessary. A short news reaction, long interview, and gaming session should not automatically share the same benchmarks.
Quarterly or after a test cycle
Review larger decisions such as schedule, content mix, platform selection, multistreaming workflow, and monetization. Change one or two variables at a time when possible. If you alter the title, thumbnail, starting time, guest format, and call to action together, the result will be harder to interpret.
Reusable review template
- Broadcast: date, platform, topic, format, duration, and stream link.
- Objective: the single primary outcome for this broadcast.
- Context: title, thumbnail, schedule, promotion, guests, and technical notes.
- Results: concurrent viewers, average watch time, retention, chat rate, clicks, follows or subscribers, returning viewers, and revenue.
- Moment review: strongest timestamp, weakest timestamp, and what happened at each.
- Interpretation: the most supported explanation for the result and any uncertainty.
- Next test: one specific change, its reason, and the metric that will indicate progress.
How to interpret changes
When viewers leave early, first inspect the opening rather than assuming the topic failed. Was the promise clear before people had to wait? Did the stream begin with silence, setup, a long introduction, or a technical issue? Test a shorter opening, state the value of the broadcast, and tell viewers what will happen next. A revised scene structure may help; the OBS Studio scene setup guide can help you prepare transitions and starting layouts.
If concurrent viewers fall during a particular segment but chat remains active, the segment may be serving a smaller, more committed audience rather than failing outright. Consider whether that portion belongs later in the show, needs clearer framing, or should become a separate recurring format. If viewers stay but do not engage, make participation easier with a specific question, a choice between two options, or a clear invitation to share an experience. Do not rely on a generic request to “say hi” as your only prompt.
If clicks are low while retention is healthy, check the relevance and placement of the call to action. Explain why the destination matters, give a short spoken instruction, and use a trackable link where appropriate. If clicks are high but follows or returning viewers are weak, the promotion may be attracting one-time intent rather than a durable audience. Align the title and promotion with what the broadcast actually delivers.
When revenue changes, separate audience behavior from reporting timing and attribution. A lower reported total may reflect delayed reporting or a different mix of transactions rather than an immediate decline in interest. Review revenue alongside watch time, returning viewers, and the stream’s objective. For broader planning, see how to monetize live streams without treating monetization as the only measure of a healthy channel.
Technical quality can distort every other metric. Before changing content, confirm that the microphone, camera, connection, bitrate, and scenes worked as intended. These resources can help: microphone guide, camera guide, and bitrate and internet speed guide.
When to revisit
Use this guide after every broadcast for data capture, once a month for trend review, and once a quarter for format and schedule decisions. Revisit sooner when you launch a new platform, change streaming software, begin multistreaming, introduce a new call to action, or test a different title, thumbnail, schedule, or show structure. A multistreaming workflow may also require separate platform notes because a combined audience total can hide important differences in retention and chat behavior.
Analytics interfaces, metric definitions, attribution rules, and reporting limits can change. Check the platform documentation or dashboard labels before comparing a new report with older records, and refresh your internal template at least twice a year. Keep a brief change log: what changed, when it changed, and whether historical data was affected.
For your next review, choose one recent stream and complete the template in 15 minutes. Mark one moment where viewers left, one moment where they participated, and one result connected to your primary objective. Then select one controlled change for the next broadcast. That simple loop—measure, interpret, test, and revisit—turns live stream analytics into a practical audience-growth system rather than a collection of disconnected dashboard numbers.