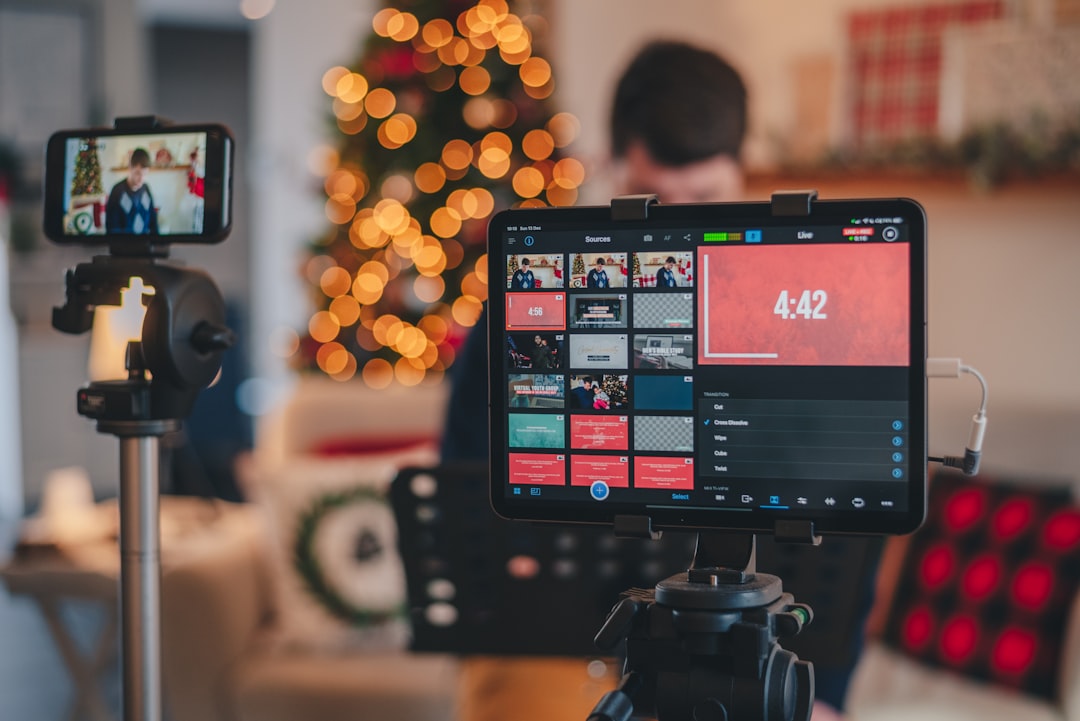
Live stream analytics turn a broadcast from a one-time event into a repeatable growth process. This guide explains which livestream metrics to track, what each one can reveal, and which practical experiment to run when performance is weak or changes unexpectedly.
Overview
A live stream can look successful because the peak viewer count was high, yet still produce little watch time, conversation, or audience growth. Conversely, a smaller broadcast may perform well if viewers stay longer, return for the next show, and take a useful action.
The goal of a stream analytics guide is not to make every number increase at once. It is to connect a result to a decision. If viewers leave early, improve the opening. If people watch but do not follow, clarify the reason to return. If your audience is engaged but discovery is weak, test the title, thumbnail, category, schedule, or promotional clips.
Platform dashboards use different names, time windows, and calculation methods. Treat the definitions shown in your current dashboard as the source of truth, and record the date range and platform whenever you save a result. For consistent comparisons, review streams with similar formats, durations, topics, and promotion levels rather than comparing every broadcast in one group.
A useful measurement system has three layers:
- Reach: How many people encountered or entered the stream?
- Experience: Did viewers stay, participate, and find the broadcast useful?
- Outcome: Did the stream create followers, returning viewers, clicks, or revenue?
Before changing production equipment or streaming software, identify which layer is weakest. A new overlay rarely solves a retention problem caused by a slow introduction, and a better camera will not fix a stream title that attracts the wrong audience.
What to track
The table below provides a practical starting set of livestream metrics to track. You do not need to optimize all of them simultaneously. Choose one primary objective for each broadcast and use the remaining metrics as diagnostic signals.
| Metric | What it indicates | When it is weak | First experiment to try |
|---|---|---|---|
| Concurrent viewers | How many people are watching at the same time during the broadcast | Discovery, timing, or promotion may be limited; a high peak may not mean sustained interest | Test a clearer event promise, a more consistent start time, or promotion before the stream |
| Average watch time | How long viewers typically remain with the stream | The format may be too long, the pace may be uneven, or the opening may not deliver quickly | Move the main payoff earlier and divide the show into visible segments |
| Retention rate | How the audience changes across the broadcast or at specific moments | Viewers may leave during setup, transitions, repeated explanations, or technical problems | Review the first minutes and major drop-offs, then shorten or restructure those sections |
| Chat rate | How actively viewers participate through messages or other interactions | The subject may not invite response, or viewers may not know how to participate | Ask one specific question, use a prompt at a planned interval, and acknowledge replies |
| Click-through rate | How often viewers click a linked destination, card, panel, or call to action when the platform reports it | The offer may be unclear, poorly timed, or mismatched with the stream | Use one primary call to action and explain its benefit at the moment of relevance |
| Followers gained | How much the stream contributes to audience growth | Viewers may enjoy the show but lack a reason to receive future broadcasts | State what recurring value the channel provides and invite a follow at a natural point |
| Returning viewers | Whether people who have watched before come back | The schedule, format, or series promise may be inconsistent | Create a repeatable show structure and announce the next broadcast before ending |
| Revenue per stream | The income attributed to the broadcast under the platform’s reporting rules | Monetization may distract from the viewer experience or lack a clear offer | Compare revenue with watch time and engagement, then test one relevant support or sales prompt |
Use rates alongside totals
Totals describe scale; rates often describe efficiency. For example, followers gained is useful, but followers gained divided by unique or average viewers can make broadcasts of different sizes easier to compare. The same principle applies to chat activity and clicks. Label your calculation clearly because platforms may use different audience denominators.
Do not treat revenue per stream as a complete measure of success. A stream designed to build awareness may have little immediate revenue but strong returning-viewer growth. Likewise, a sales-focused broadcast should be reviewed for both revenue and audience quality. A short-term result is more useful when paired with the behavior you wanted to create.
For production context, note stream duration, topic, format, start time, platform, promotion used, technical issues, and any unusual event. A simple spreadsheet can reveal patterns that are difficult to see in separate platform dashboards. If you are comparing multiple destinations, record each platform independently before judging the combined result. A multistreaming workflow may expand reach while producing different retention and chat behavior on each platform; see the multistreaming tools comparison for workflow considerations.
Cadence and checkpoints
Reviewing analytics immediately after a broadcast is useful, but an early result should not automatically trigger a major strategy change. Give the stream enough time for delayed views, replays, clips, and post-stream discovery to appear according to the platform’s reporting behavior.
After every stream
- Save the main metrics, stream duration, topic, start time, and platform.
- Write down what changed from the previous comparable stream.
- Review the opening and any obvious retention drop-offs.
- Record one audience question, comment, or moment worth developing.
- Choose one experiment for the next broadcast.
The purpose of this checkpoint is memory. Notes made days later tend to omit technical interruptions, confusing segments, or moments when chat became unusually active.
Weekly review
Once a week, group recent broadcasts by format or goal. Compare median or typical performance where possible rather than allowing one unusually large or small stream to define the conclusion. Ask whether the same issue appears repeatedly: low discovery, an early retention decline, weak participation, or limited conversion to followers.
A practical weekly review template is:
- Best signal: Which metric improved, and what changed before the stream?
- Weakest signal: Where did the audience or outcome fall short?
- Likely cause: What evidence supports the explanation?
- Next test: What single change will be made?
- Success condition: Which metric should move, and over how many comparable streams?
Monthly or quarterly review
Use a longer review to assess direction rather than individual performance. Look at audience growth, returning viewers, average watch time, stream frequency, top formats, and revenue together. This is also the right time to check whether your platform dashboard has changed metric names, report locations, attribution windows, or definitions. Keep historical notes rather than silently replacing old labels; otherwise, future comparisons may become misleading.
How to interpret changes
Analytics are clues, not explanations. A metric can move because of content, timing, promotion, technical quality, platform distribution, seasonality, or an audience shift. Build a diagnostic workflow that moves from the result to the most plausible controllable factor.
High reach, low retention
This pattern often means the promise attracted attention but the opening did not confirm it quickly enough. Compare the title and promotional message with the first minutes of the show. Remove long setup screens, explain the agenda, and deliver a useful moment early. Check whether the stream began on time and whether audio or video problems affected the opening.
Low reach, strong retention
A small audience that stays may indicate a content and experience problem has been solved while discovery remains limited. Test stream title SEO, thumbnails where available, announcement timing, collaborations, short clips, and a consistent schedule. Avoid changing the show itself before testing how people find it.
Strong watch time, low chat rate
Some formats naturally encourage quiet viewing, so low chat is not automatically a failure. If participation matters, add specific prompts rather than broad questions such as “What do you think?” Ask viewers to choose between two options, submit a question for a defined segment, or help decide the next demonstration. Make participation possible without interrupting the main content.
Strong engagement, low follower growth
Viewers may be interested in the individual topic but unclear about the continuing value of the channel. Explain what future streams cover, maintain a recognizable series name, and place the follow request after a useful moment. Review whether the stream attracts people outside the audience you intend to serve.
Revenue rises while retention falls
Review the timing and frequency of monetization prompts. A result that increases immediate revenue but weakens the viewing experience may not be sustainable. Compare revenue with returning viewers, watch time, and audience feedback before repeating the same approach. For broader planning, consult the live stream monetization playbook.
When technical problems are suspected, separate content diagnosis from setup diagnosis. Check connection stability, bitrate, dropped frames, audio levels, and scene transitions using your current streaming software reports. The bitrate and resolution guide can help you review the technical baseline before attributing a retention change to the content.
When to revisit
Revisit this measurement system after every stream for notes and one next experiment, weekly for patterns, and monthly or quarterly for strategic decisions. Return sooner when a platform changes its analytics dashboard, renames a metric, changes the available reporting window, or separates live and replay data differently. Your definitions and formulas should be updated before you compare new results with historical ones.
Use the following action plan for your next review:
- Choose one objective: discovery, retention, participation, audience growth, clicks, or revenue.
- Record the eight core metrics where the platform provides them, marking unavailable data as unavailable rather than estimating it.
- Compare the broadcast with two or more similar streams when possible.
- Inspect the retention timeline and note the first meaningful drop or lift.
- Write one evidence-based explanation and one alternative explanation.
- Run one controlled change in the next stream, such as a revised opening, title, schedule, prompt, or call to action.
- Review the result at the same checkpoint and keep the change only if the intended metric improves without damaging a more important outcome.
Keep the process small enough to repeat. A dependable weekly record is more valuable than an elaborate dashboard that is rarely updated. Over time, this habit shows which topics attract the right viewers, which openings hold attention, and which promotion methods create people who return. That is how live stream analytics become a practical audience-growth system rather than a collection of numbers.